
In this article, we’re going to talk about improving your eCommerce content marketing using Google Analytics. You will find how to optimize your internal content to draw in as much traffic as possible.
Your site’s media content, coupled with its SEO techniques, is one of its biggest magnets in attracting wayward shoppers.
And because content’s effectiveness depends on your average customers’ individual preferences, Google Analytics eCommerce data allows you to hone in specifically and maximize its effects.
Let’s talk about which metrics are the most helpful, how to tell which type of content works best, and what your demographic data can suggest for improving your content marketing strategy.
Table of Contents
#1. Top 3 Crucial Google Analytics eCommerce Metrics
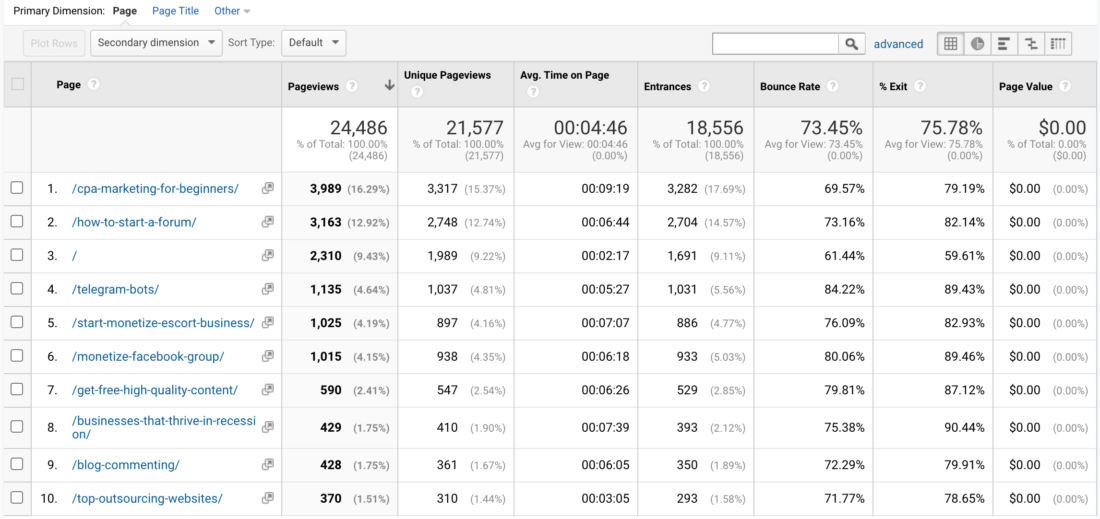
The best place to start is with the three most revealing Google Analytics eCommerce figures: Pageviews, Avg. Time on Page, and Exit Percentage.
When considering these three factors for each of your content pages, you’ll be able to see which ones have the most significant impact and why.

Spend enough time in Google Analytics, and you’ll start to recognize patterns that help you determine what kind of content to develop in the future.
All three of these metrics are found in Behavior > Site Content > All Pages. These data sets work on all pages of a site, too, not just content posts.
1.1 Pageviews
Of the three metrics, Pageviews is the simplest, but also the vaguest. This makes it great to give quick and somewhat accurate first impressions, but it requires additional data before making concrete assessments.
Pageviews are the number of times the page has been viewed, including repeated visits by the same shopper. (Unique Pageviews are the number of sessions in which the page was viewed at least once.) Successful pages always have many page views, and floundering pages always have a low number.
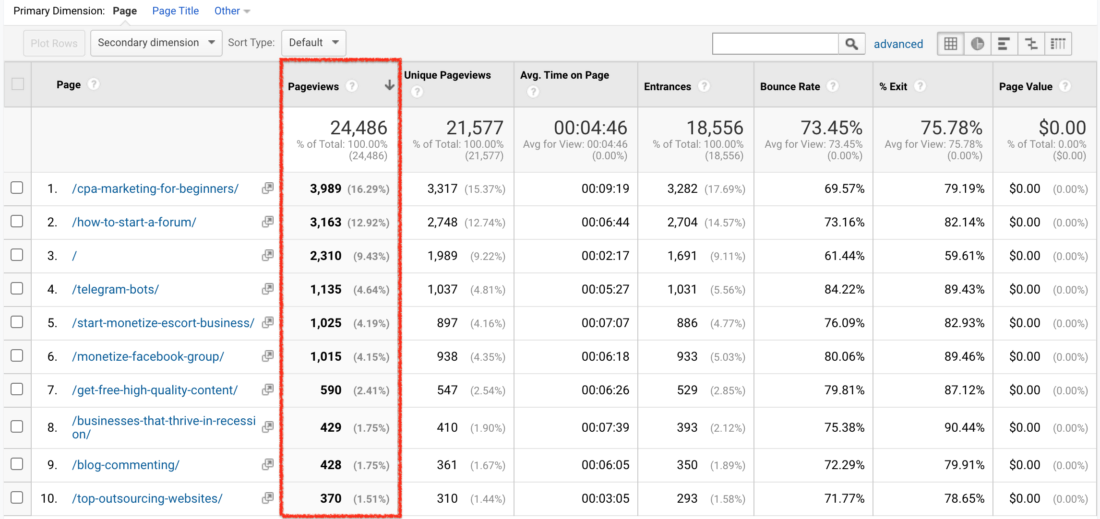
The difficulty, though, is that pages with a lot of page views aren’t always successful. For example, Clickbait can have a high number of views, but the visitor bounces almost immediately when the content disappoints them. That’s why it’s always important to cross-check a post’s page views against the time on page and Exit %.
1.2 Avg. Time on Page
Essentially, the average time on page statistic measures how interesting a post is. The longer a visitor stays on a page, the more engaged they are. This metric is perfect for separating quality content from clickbait or trap titles.
You can even calculate whether or not they read the entire post. According to Marketing Land, 200-250 words per minute is a safe estimate for the average person’s reading speed.
Compare the post’s word count to the time on the page to see exactly how much of the article most people read. Then, try to replicate the elements that made the most intriguing by looking at what all popular posts have in common.
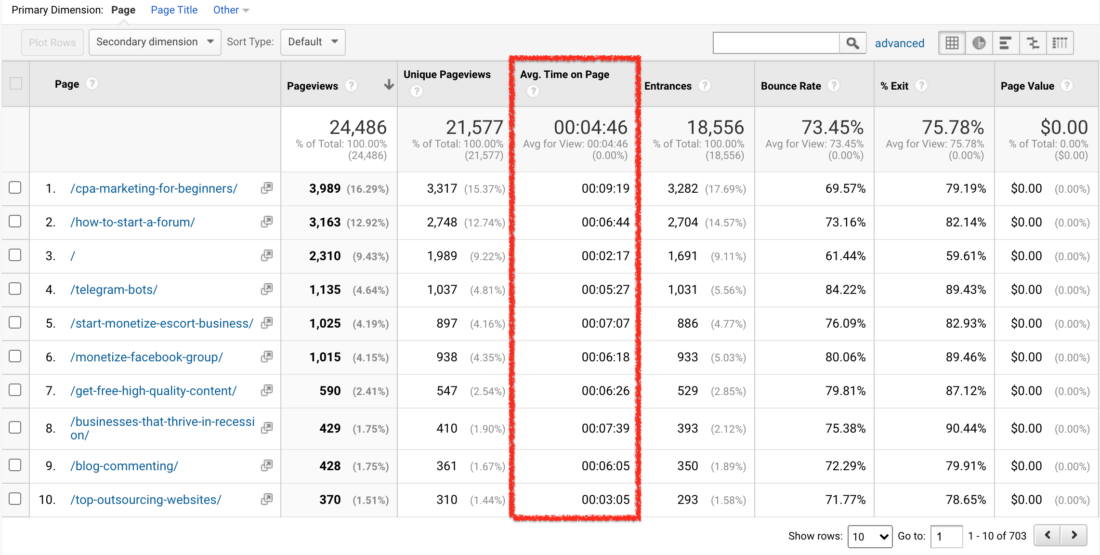
One other note about avg. Time on page: sometimes, it indicates navigation problems. If a visitor lands on the page in error or as a result of confusion, they’ll quickly exit the page, sometimes to retrace their steps, or else abandon the site. Once or twice shouldn’t affect the average much, but if the problem persists, you’ll be able to notice a difference here.
1.3 Exit %
Measuring the number of times visitors leave the site after viewing a page, exit % adds another critical layer to analyzing a post’s success.
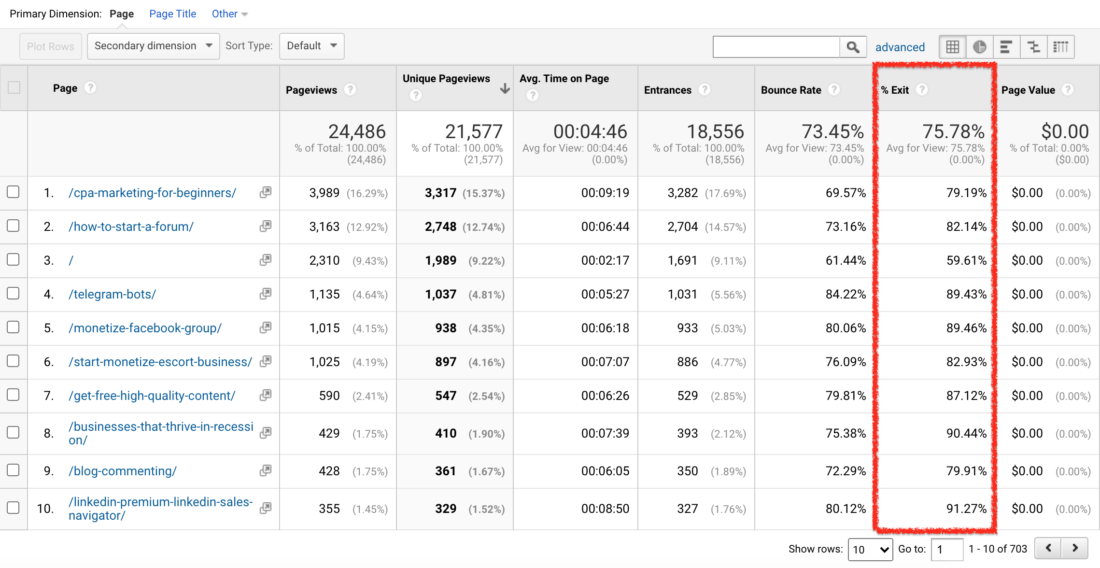
Like the Avg. Time on Page can determine whether or a person arrived on your site in error. If landing pages have a high exit percentage, it means they’re not as effective as they should be. Exit % can show you which squeaky wheels need the most grease.
Exit % can also be a loose indicator of how interesting your content is. Good, engaging content makes people want to stay on the site and continue reading posts. Poor content makes them leave the entire site faster.
1.4 Putting it All Together
Considering these three factors on each post, you’ll be able to see the most effective posts for attracting visitors and keeping them interested.
You’ll be able to make smarter decisions on areas like:
- Post Length
- Best Times to Publish
- How Frequently to Publish
- Format of Content (blogs, infographics, videos, etc.)
- Best Content Creators
- Topics for Content
However, the post’s performance in relation to other posts doesn’t speak much about how it’s helping your site’s overall strategy. Producing content that people enjoy is one thing, but is that content actually aiding your sales? For that, you need to look at conversion data.
Further readings on content creation for e-commerce:
#2. Google Analytics eCommerce Data for Conversions
Google Analytics eCommerce allows you to organize your data according to how it suits your site’s individual goals – which you can also customize. The entire Conversion section is dedicated to this, with the eCommerce subsection handing sales and financial figures and the Goals sections letting you set your own metric for success.
Use the eCommerce section for a straightforward account of where your money’s coming from. In terms of content strategy, this shows you which products are more valuable and in-demand, so you know what to mention in your posts.
You can read more about how to use this data in our previous article on how to use Google Analytics eCommerce data directly to increase sales.
The Goals section, however, is more useful for hands-on management. Here you can set your own metrics for success, and Google Analytics eCommerce will automatically calculate how well your pages meet that goal.
Because you choose your own goals, it enables you to be more creative in your marketing strategies and stray from the norm with less risk.
For some inspiration, here are some worthwhile goals to examine on your site aside from finances:
- Checkout completion
- Email signups
- Downloading certain items
- Video plays
- Image views
- Spending over a certain amount of time per session
- Spending over a certain amount of money
- The number of items in a cart
- The number of items viewed.
Of course, these are just suggestions. Think outside of the box yourself to implement some original strategies that incorporate conversion goals.
Just like the other content marketing data, isolate the factors and patterns for the types of posts most effective at accomplishing your site’s goals, whatever they are.
#3. How Demographic Data Influences Content Marketing
In our previous article, we explained the actionable uses for demographics data for your eCommerce site. For example, younger visitors prefer less text. Women are more responsive to email marketing, etc.
We don’t want to retread our same points here, but we will mention that this demographic data works just as well on your content strategy.
While the age and gender can give you a broad direction for the type of topics to post about, serious content marketers will want to pay more attention to the Affinity Categories (Audience > Interests > Affinity Categories).
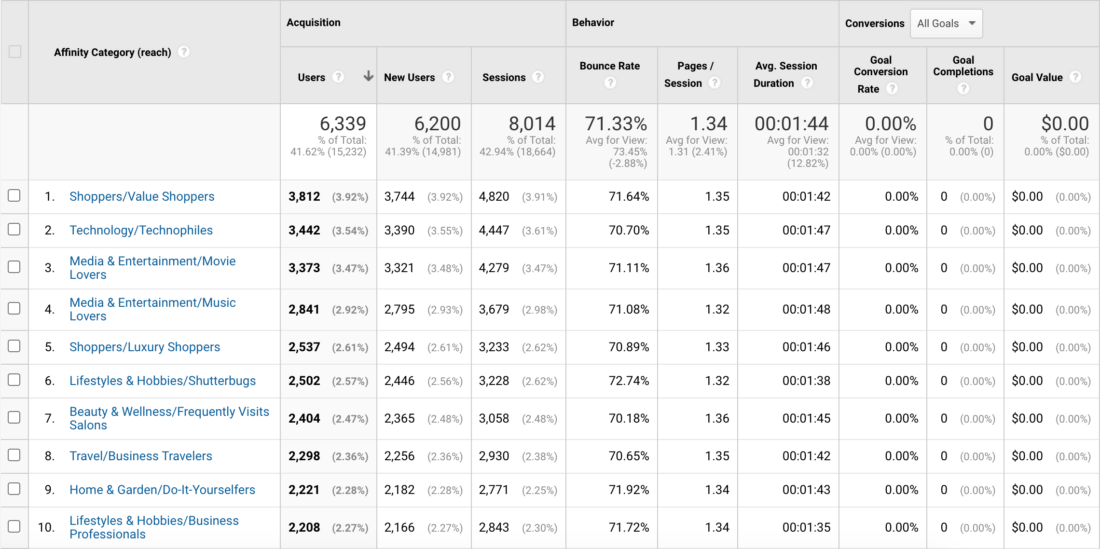
This area breaks up your shoppers into interest groups, such as “movie lovers” or “technophiles.” This data was initially created to determine which types of products an online store should focus on, but the information works equally to decide what topics to discuss.
Pay attention to what your typical shoppers are interested in – in other words, but kind of posts do they want to read or watch? Like other data sectors, this area also shows the secondary data like conversion rate and money spent to target the most lucrative interest groups along with the most popular.
#4. Experimenting
One of the great parts about having a Google Analytics eCommerce report handy is that you have more freedom to experiment and try new strategies. If you have a new idea for an unconventional post but are unsure whether it will work, these statistics will clearly show you how it compares.
The more detailed statistics can even show where you went right or wrong – for example, high page views with low time on site meant the idea appealed enough to get clicks, but the content failed to deliver what the shopper expected.
Remember to keep experimental posts controlled, though, so the data reflect the post’s quality and not some secondary variable like the time it’s posted or how it’s promoted.
Further readings on eCommerce experimenting:
#5. SEO
While we’re discussing content strategy and attracting users to your site with your internal pages, we would be remiss if we didn’t mention how Google Analytics eCommerce data works with SEO.
The basic method shows the number of organic searches that ended up on your site and the keywords that lead them there. You can see this by first going to Acquisition > All Traffic > Channels and then clicking on “Organic Search.”.
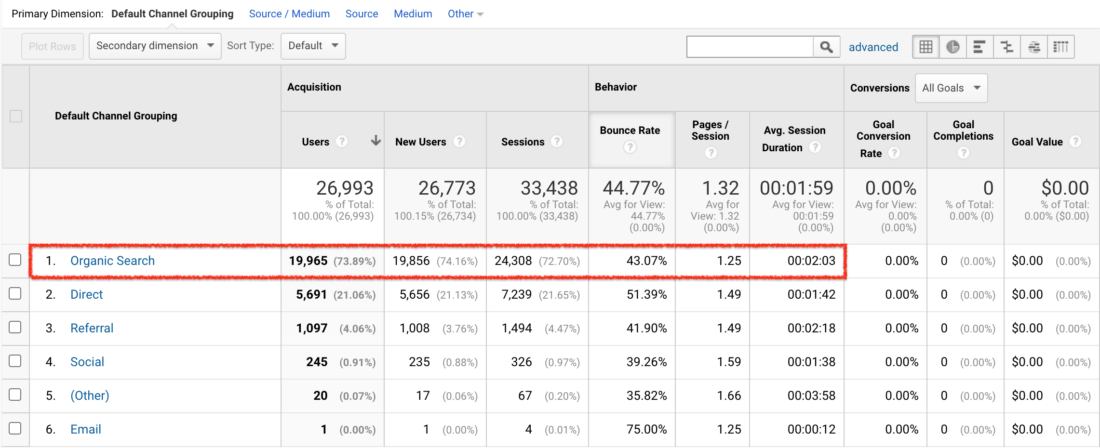
Here you can see a list of the most common search terms that lead to your site and how visitors who used the individual terms perform.
For example, maybe the keyword “affordable beauty products” brings the most people to your site, but the keyword “organic skin cream” leads to the most sales. Now you know to favor “organic skin cream” in your SEO strategy or make some changes to the customer journey for “affordable beauty product” searchers.
The SEO data from Google Analytics eCommerce can also be used to check your progress on your current SEO strategy. Areas like SEO don’t always go as planned, so you’ll need to constantly monitor real traffic data to know how close you are to the mark.
Further readings on SEO for eCommerce:
- How to build backlinks for eCommerce [The Ultimate 2020 Guide]
- Ecommerce Link Building: 9 Proven Tips That Drive Buyers To Your Site [Outreach.buzz]
- How to do a backlinks audit in 60 minutes [Complete Guide]
- 41 FREE Sources for Instant Backlinks to Your Content [With Real Examples]
- How to Get Powerful Backlinks with Blog Commenting
#6. Integrate Search Console with Google Analytics
Of course, this is just basic information. If you want to explore SEO with more advanced, top-tier data, add Search Console for Google Analytics eCommerce. This add-on provides exclusive SEO figures, including the number of URL impressions in search results and post-click engagement for bounces or conversions.
Before it begins collecting data, you need to add your site to the Search Console registry. Google Support outlines the easy steps for this here.
6.1 Get Information about Organic Traffic
Then navigate to Acquisition \ Search Console \ Landing Pages to have a complete overview of how your pages appear and perform in Google search.
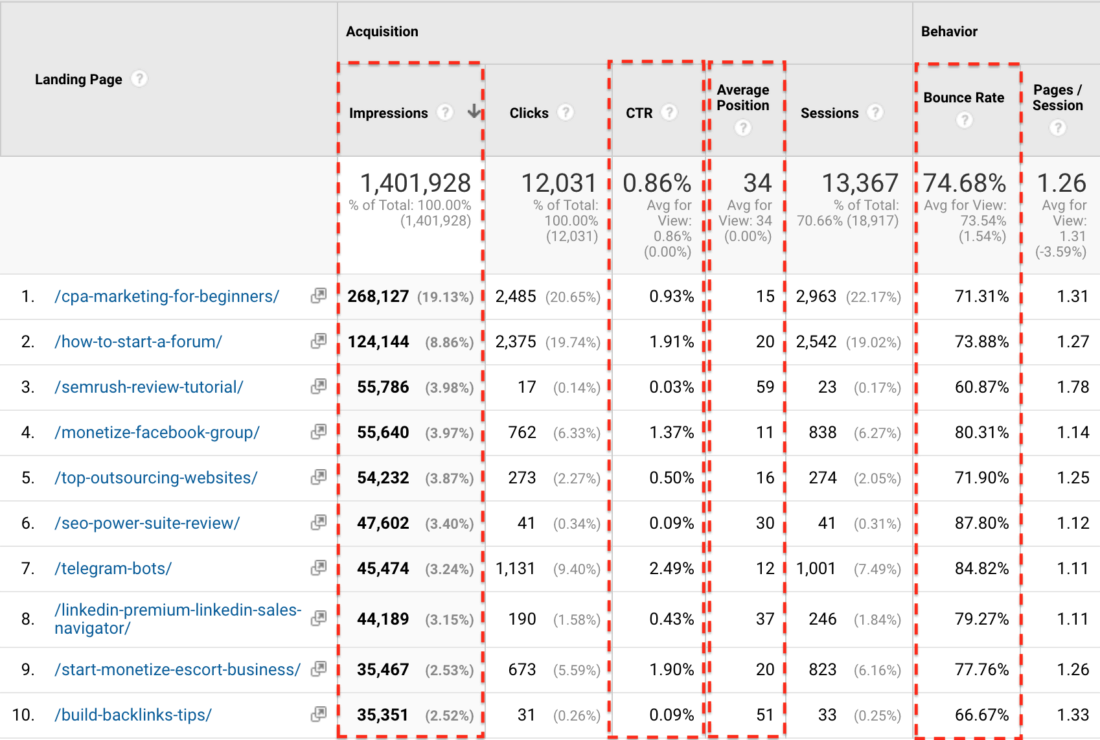
Let’s describe the information you will see for a particular URL in Search Console integration:
- Impressions – The number of times your page appeared on Google Search page for a particular query, no matter the position.
- Clicks – The number of times your page was clicked (chosen) by a visitor that did a search
- CTR – The perfect of clicks versus the number of impressions.
- Average position – The average position in Google Search for all keywords that rank for a specific page.
- Bounce rate – The rate of people that do not visit any other page from your site and leave. For example, a 50% bounce rate for a search query tells you that half of the people head back to the Google search results page (or close their browser), and the other half of people go on to view at least one more page on your website.
Having all this information at your disposal can easily make your content awesome and get more traffic. Let’s get some cases and the fixes you should make.
Issue #1: The pages have a small number of impressions
This means that Google does not rank your pages well and doesn’t consider your content too valuable to show it to the visitors.
How to fix: Check the content of these particular pages, update it with details, case studies, and more relevant details. Also, it would help if you got some good backlinks to those pages.
Issue #2: The pages have a low CTR
This means that the visitors do not pick your result in Google searches, and instead, they choose pages from your competition.
How to fix: You should rewrite your title and the meta description making it more appealing for the visitors to choose your result instead of your competitors. Also should improve the ranking of your keywords. If your result appears on position 10, the visitors will choose the first results and not scroll to your page.
Issue 3: The pages have a high bounce rate
This means that people are leaving the pages by hitting the back button, selecting other Google results, or closing the browser. It would help if you always aimed for a low bounce rate.
How to fix: First, make sure the content is relevant for what users are searching for, and the users can easily find the answer to their question. Secondly, you should persuade users to visit more content of your website or take action by leveraging CALL TO ACTIONs.
6.2 Get information about visitors’ countries
Navigate to Acquisition \ Search Console \ Countries to have an overview image of the top countries where your organic traffic comes from.
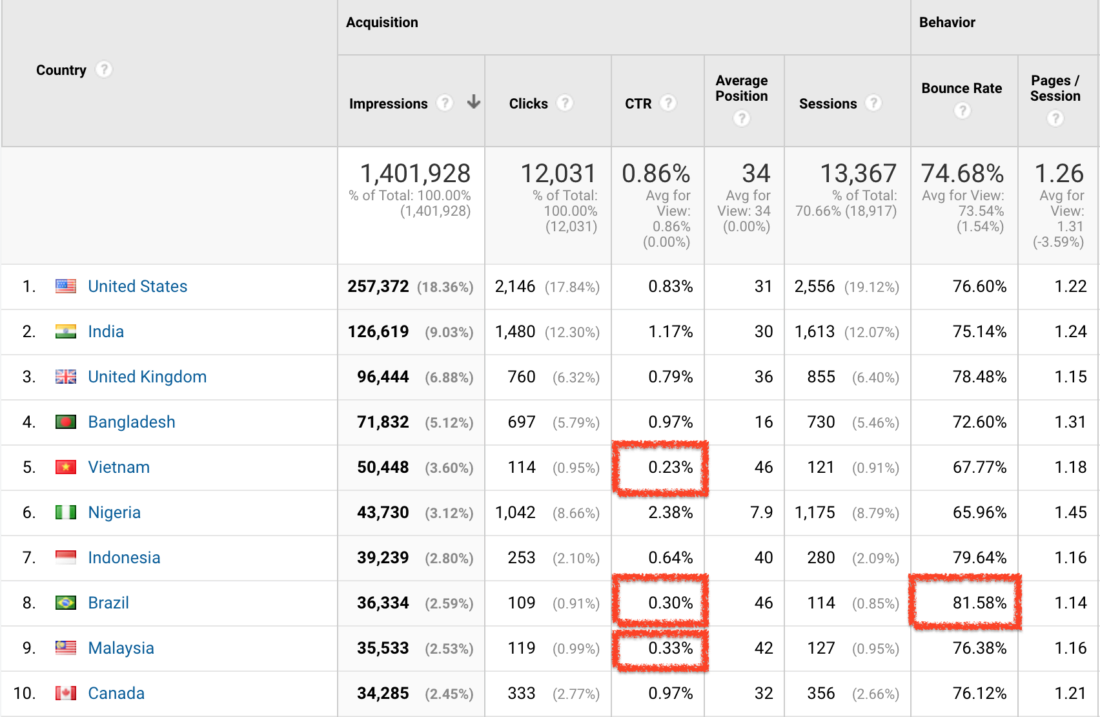
Issue #1: Low CTR in some countries
As you can see in the picture above, there are several countries where our CTR is up to 3 times lower, or the bounce rate is higher. I consider that in Brazil, we have a lower CTR because there are local pages that rank better.
How to fix: My solution for this issue is to create localized content for the countries interested in getting better rankings.
6.3 Get information about keywords
Another important part is the information about the keywords you are ranking for. Navigate to Acquisition \ Search Console \ Queries. Here you can see detailed information about each keyword you are ranking for.
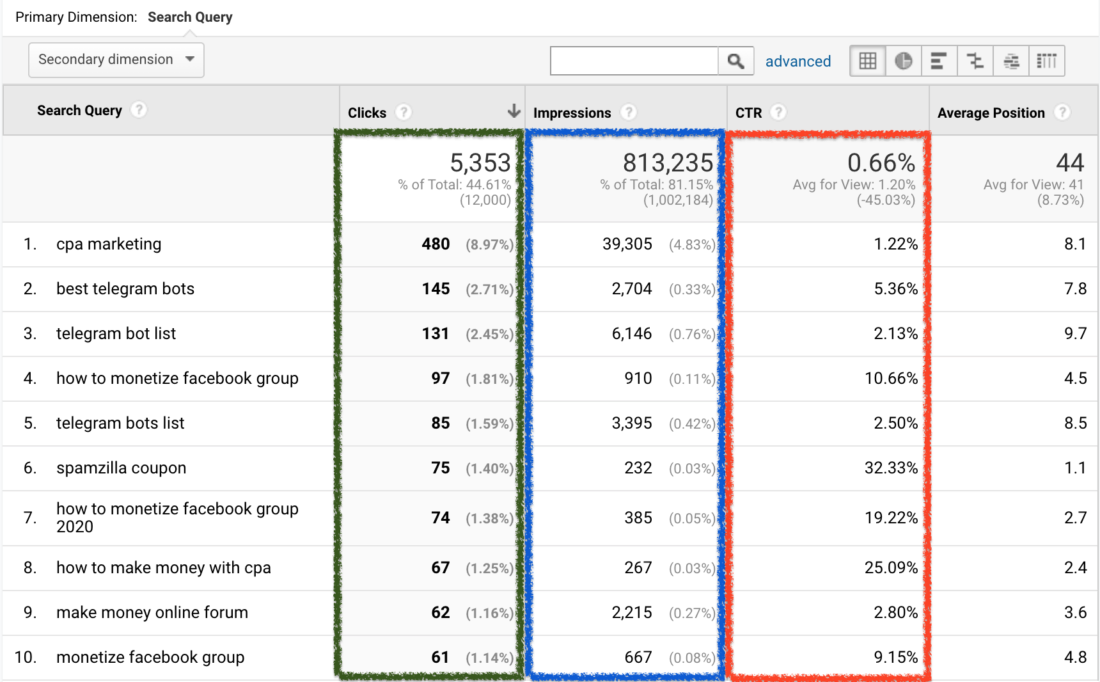
- Search Query – The keyword or the keyphrase your content is ranking for.
- Clicks – The number of clicks you’re getting from Google for a given search query in the selected time frame.
- Impressions – The number of times your content appears in search of a given keyword.
- CTR – Click Through Rate of Clicks over Impressions
- Average position – The average position of a search query in different Google pages. For instance, you are ranking #1 in the US and #3 in the for a given keyword UK, the average position is #2.
The Search Console reports inside Google Analytics provide insights that aren’t available using Google Analytics alone.
Start by using the reports to identify areas that you can improve. Once you’re optimizing your content, you can use them to check your progress. Look for search queries and landing pages where you’ve increased the CTR improved your average position, and increased clicks coming through to your website.

The bottom line is that you can continue optimizing your pages once you know what’s working for you.
Takeaway
What are your favorite Google Analytics data for your eCommerce content marketing strategy? If you don’t use analytics, how do you gauge your success? Add your opinions and advice in the comments section now.


Google analytics is my strong point. I studied this topic in the courses and got into it as much as possible. I’m wondering how content marketing can be used to promote products or services. And I know for sure that quality posts are the key to success in this matter. I have a problem with that. My writing skills are not up to par. I’ve always used writing services. Perhaps even now they will be able to help me in writing good posts.
I already took four works for expertpaperwriter.com and everything came on time. I recommend the company because they are the only ones on the market who write such good articles on any topic.
Hi Stephan, I very much enjoy your content. I am on my SEO journey and your articles inspire me. This article is demystifying Google Analytics for me. About to build and in the process of building an Amazon affiliate website and your information is gold!!! Keep up the great work and I look forward to reading your next article.